<< Lesson 6
Lesson Overview – this lesson discusses data and identification strategies that have of late been adopted by development economists
In Topic 2, we mentioned that development economics is a very empirical subject. Policy makers, researchers and governments always want to know the best policy prescriptions and the right mix thereof. Without this knowledge, resources cannot be allocated efficiently. In the aftermath of the Covid-19 outbreak, governments the world over were seized with coming up with measures to resuscitate and stimulate the economy. After implementation, the next logical step is always evaluation after some time to check progress on the adopted courses of action. This is where econometric techniques come in. In evaluating the effect of economic (or other policies), it is important not only to establish correlations but causal effects. This is the subject of the discussion in this section.
6.1 OPERATING IN A DATA SCARCE ENVIRONMENT
We also mentioned that development challenges cluster in developing countries (which may roughly equate to low and lower middle income countries) although developed countries have their fair share of problems.The sad reality is that detailed micro-data for empirical analysis is acutely in shortage in developing countries. In the context of Africa, Devarajan (2013) cites an “African Statistical Tragedy” in which governments do not have have:-
- Financial Resources, or
- Political Will
to provide objective, reliable data at the right temporal and spatial frequency. Illustrating the data accuracy and reliability issues in Africa, Rodrik (2016) is skeptical of Africa’s positive growth outlook while Jerven (2010) finds an upwards bias in Botswana’s national income accounting. On the other end of the spectrum Harrtgen, Klasen & Vollmer (2013) does not find similar evidence. Regardless, Remotely Sensed (RS) data can fill important data gaps in Africa and other regions. RS data has a number of important attributes. For starters, spatial econometric modelling naturally requires geo-coded datasets. Even econometric analysis not explicitly modelled spatially relies on geo-coded data – for example small area estimation. Small area estimation may be highly effective when evaluating average effects of area specific interventions, for example inoculations, deworming exercises etc. that affect whole regions. There are different types of RS datasets, including the following:
6.2 SOME EXAMPLES OF RS DATASETS
- Night Lights Data – correlates highly with economic activity, poverty, welfare among other indicators and is hence suitable for such analyses. Figure 9 shows high correlation between night lights and ward level poverty estimates (based on Census 2012) for Zimbabwe.
- Normalised Difference Vegetation Index (NDVI) – suitable for studies on crop quality and nutrition (among other indicators) particularly for rural areas. In urban areas, NDVI of leafy suburbs can also detect wealth.
- Satellite Imagery – Can be used in computing spectral indices (multi-purposes) (NDVI is one of them). It is also used for Object Based (OBIA) and Pixel based classification land use classification. Figure 10 shows the use of machine learning to detect crops under cultivation that can be used to evaluate the effects of interventions in the agricultural sector. In Figure 10, the B & W image on the right panel is predicted by applying a Support Vector Machine (SVM) Learning algorithm on the Landsat bands. The Near Infrared (NIR) image composite on the left panel can be used in creating Regions of Interest (ROI) polygons that can be split into training and testing sets.
- Archival Maps – Can be digitised and saved as shape files or other GIS formats. These data can then be used in econometric identification especially where there was geographical variation in treatment assignment.
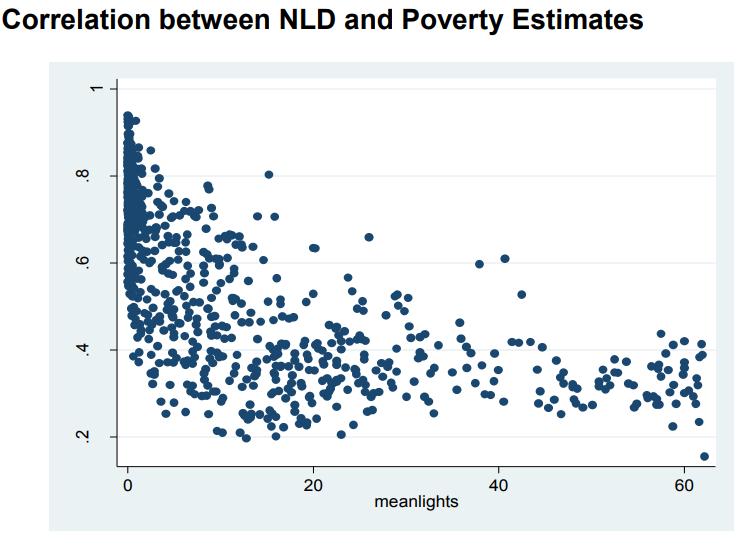
Figure 9 Correlation between night lights and poverty
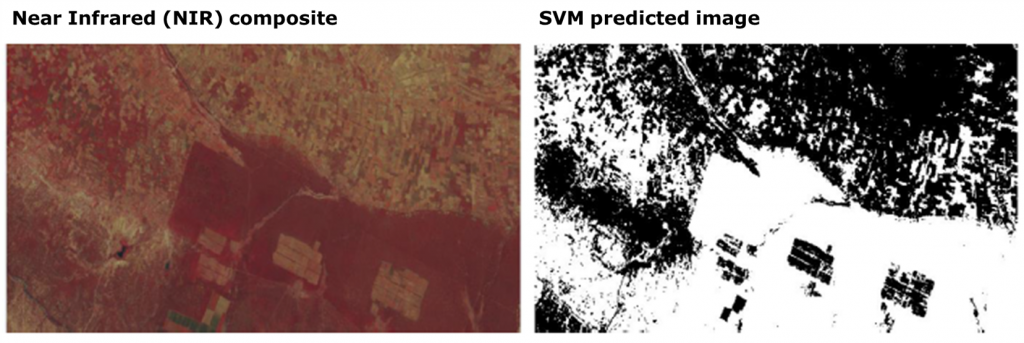
Figure 10 using machine learning to generate cultivation data
Apart from machine learning, development economics data can also be generated through citizen science. Figure 11 shows the use of the Zooniverse platform to identify informal businesses, informal housing and other land use types. The informal sector is unrecognised and “illegal” by definition. As a result there is usually no data on the informal sector, yet it is an important part of the economy where millions live and make a living. Using satellite imagery to build a dataset on the informal sector, or using citizen science to create urban cadasters for security of tenure enforcement are important development strategies.
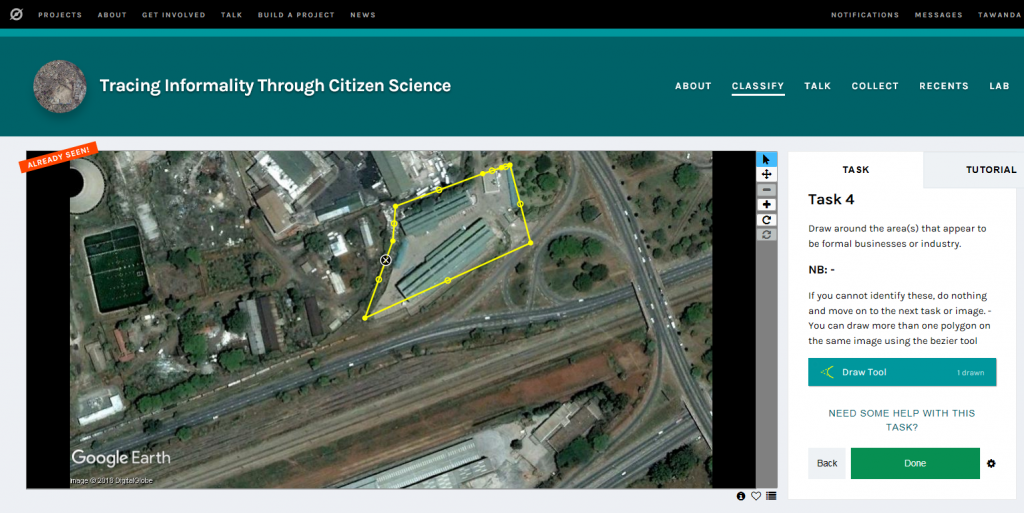
Figure 11 using citizen science to measure informality
6.3 THE NEED FOR RESEARCH COLLABORATION
The discussion in this section so far shows the importance of multi-disciplinary approaches to research. Machine learning and citizen science, while fairly newer concepts in economics have been applied in geographic sciences, astronomy and other disciplines. More cross disciplinary collaboration can therefore ensure that more development questions are answered.
6.4 ECONOMETRIC IDENTIFICATION
Econometric approaches usually mimic Randomised Controlled Trials (RCTs) in order to establish causal effects. Measuring developmental impact requires analysis to be able to deal with endogeneity, which results from reverse causality, selection and omitted variable biases (and others).
6.5 MIMICKING RCTS & DEALING WITH ENDOGENEITY ISSUES – WITH RS DATASETS
RS datasets are more objective because they are usually free from selection bias since they allow countrywide/region wide estimation. RS datasets are many times used as instruments in Instrumental Variable (IV) Estimation. In econometrics, the endogeneity problem is usually caused by reverse causality, matching problem and omitted variable bias. For example, it may be difficult to estimate the causal effect of the number of visits to the hospital and health levels due to reverse causality and omitted variable bias. In this example, the omitted variable might be a dummy variable of sickness [1,0]. In this example, we could also instrument number of visits with a variable such as distance to health facility as shown in Figure 12.
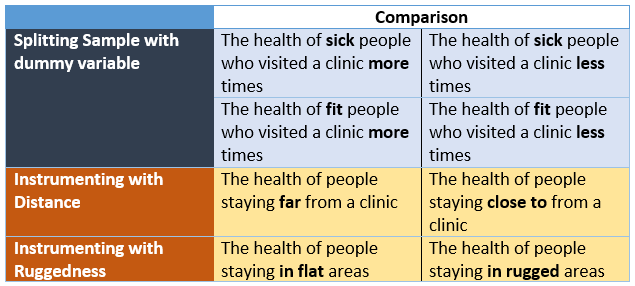
Figure 12 Dealing with endogeneity
There are specific identification techniques that can deal with endogeneity issues in econometrics. These include Matching, Difference in Difference (DID) and Regression Discontinuity Design (RDD). Matching essentially involves comparing like with like. In testing vaccines, like drug companies do during a health pandemic, care should be taken that the effectiveness of the drug is tested between comparable treatment and placebo groups. If the treatment and placebo groups are entirely composed of younger and older participants respectively – then the analysis will capture the effect of age and not the effect of the vaccine. There has to be statistical balance in both control and treatment groups. Matching employs statistical algorithms to split the main sample into two comparison groups that have the similar covariates statistically speaking – the only difference being variation in treatment. Figures 13 and 14 graphically shows the operations on the DID and RDD methodologies.
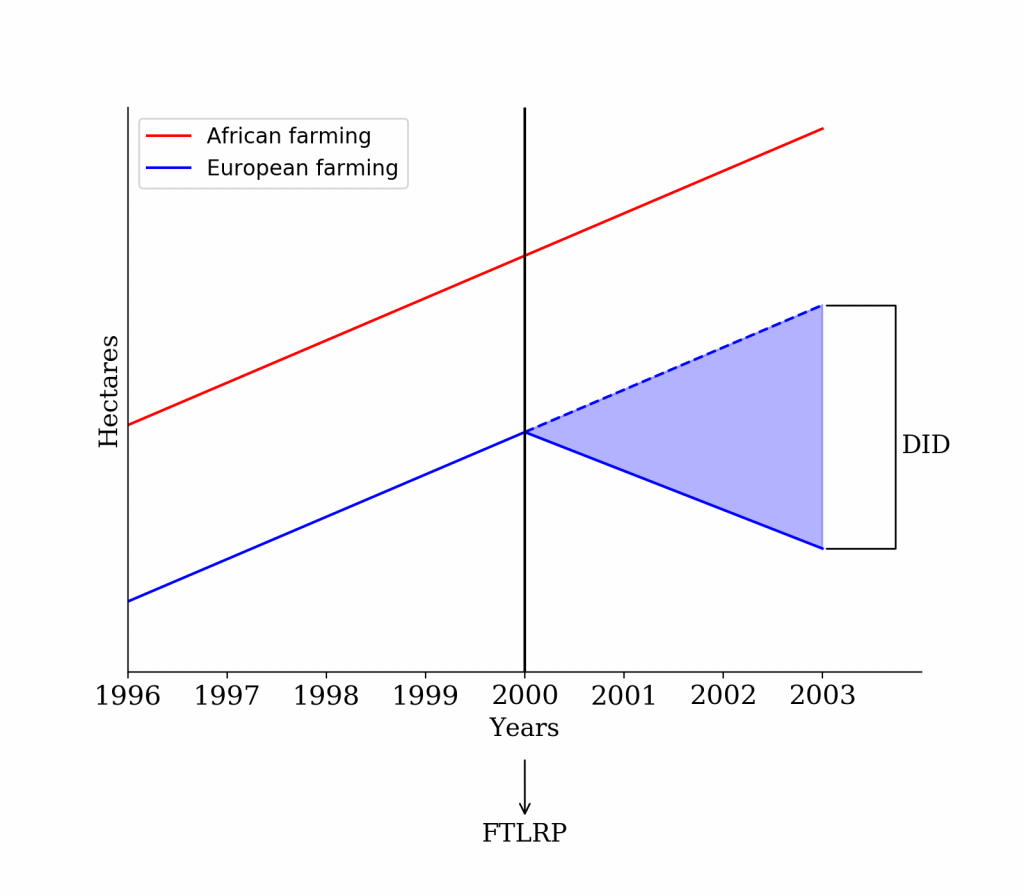
Figure 13 DID
Figure 13 shows two types of farming in Zimbabwe before and after its year 2000 Fast Track Land Reform Program (FTLRP). Before 2000, we see a common trend of a difference between African and European farming. Without FTLRP, we would expect the trend to continue beyond 2000. The dip in the European farming after 2000 is attributable to FTLRP ceteris paribus and that is the causal effect (or the difference in the difference) that is represented by the blue shaded area.
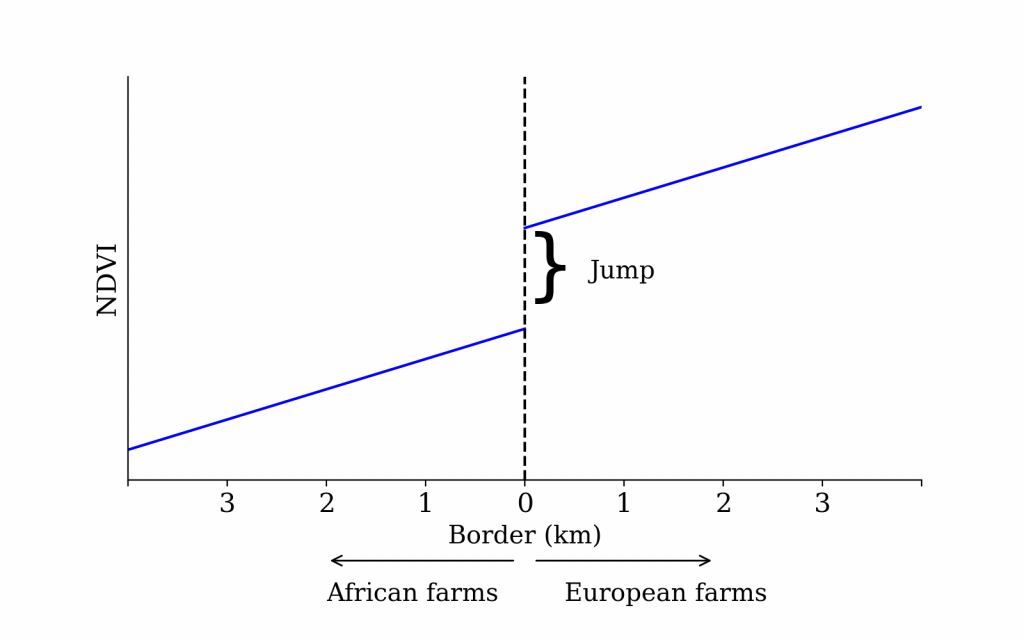
Figure 14 RDD
As discussed already, NDVI can be a proxy for vegetation health. In Zimbabwe, European farmers were wealthier than their African counterparts, hence they could afford better care of their crops in terms of pest control and fertiliser use. So if one wanted to investigate the effect of wealth on crop quality (crop management), one only needs to plot NDVI for areas close to the border between European and African areas. The discontinuity or jump at the border is the causal effect ceteris paribus.
References
- Demsetz, H. (1974). Toward a theory of property rights. In Classic papers in natural resource economics (pp. 163-177). Palgrave Macmillan, London.
- Devarajan, S. (2013). Africa’s statistical tragedy. Review of Income and Wealth, 59(S1).
- McKenzie, D., & Paffhausen, A. L. (2017). What is considered development economics? Commonalities and differences in university courses around the developing world. The World Bank Economic Review, 31(3), 595-610.
- Engerman, S. L., Sokoloff, K. L.(2000). Differential Paths of Growth Among New World Economies. Institutions, contracts, and organizations.
- Jerven, M. (2010). Accounting for the African growth miracle: The official evidence–Botswana 1965–1995. Journal of Southern African Studies, 36(1), 73-94.
- Rodrik, D. (2016). An African growth miracle? Journal of African Economies, 27(1), 10-27.
- Rothwell, J. (2013). The hidden STEM economy. Metropolitan Policy Program at Brookings.
- Ruttan, V. W., & Hayami, Y. (1984). Toward a theory of induced institutional innovation. The Journal of development studies, 20(4), 203-223.
- United Nations Development Program (UNDP) (2019), Human Development Index (HDI), available online: http://hdr.undp.org/en/content/human-development-index-hdi
- Vollrath, D. (2019), Defining Development Economics, available online: https://growthecon.wordpress.com/2014/04/18/defining-development-economics/
This course was developed by Dr. Tawanda Chingozha, development economist at the OAD. Please send your feedback on the course to tawanda at astro4dev.org.